Introduction#
In this section, an introduction to satellite missions, sensors and products available with GPM-API is provided. Concepts are introduced in a progressive manner, but feel free to skip to the section that is of interest to you.
GPM Mission#
The Global Precipitation Measurement (GPM) mission, an international collaborative effort between NASA, JAXA, and other space agencies, was initiated following the success of the Tropical Rainfall Measuring Mission (TRMM) satellite launched in November 1997.
The GPM mission aims to acquire accurate and frequent global observations of Earth’s precipitation. The mission relies on the TRMM, the GPM Core Observatory (GPM-CO) satellite and a constellation of satellites equipped with microwave radiometers which forms the so-called GPM Constellation.
The reference sensors for the GPM mission are the:
The GPM Data Archive currently includes satellite data records that extend back to 1987. This extensive archive is the result of contributions from two spaceborne radars and a fleet of 26 passive microwave (PMW) sensors that forms the so-called GPM constellation.
The data are organized into various product levels, encompassing raw and calibrated observations (Level 1), intermediate geophysical retrieval products (Level 2), and spatio-temporally integrated datasets from single and multiple satellites (Level 3).
While the GPM mission is renowned for providing a long-term data records of precipitation, its satellite data have also been essential for the quantification, monitoring and understanding of a broad spectrum of atmospheric, ocean and terrestrial surface processes. Examples include monitoring sea-ice concentration and snow-cover extent, estimating ocean wind speeds and sea surface temperatures, and profiling atmospheric humidity and temperature. Moreover, GPM data have also been crucial for identifying global hotspots for hail and intense thunderstorms, analyzing storm structures and examining the latent heat release that drives the atmospheric circulation.
TRMM satellite#
The Tropical Rainfall Measuring Mission (TRMM) satellite, launched in November 1997 as a collaborative effort between the United States’ National Aeronautics and Space Administration (NASA) and the Japan Aerospace Exploration Agency (JAXA), marked a significant milestone for the satellite remote sensing observation of tropical precipitations between 37°N/S. Its primary objective was to accurately measure rainfall associated with tropical convective activity, which play a crucial role in the global dynamics of the atmospheric circulation.
Equipped with pioneering technology including the first spaceborne Precipitation Radar (PR), the TRMM Microwave Imager (TMI), the Visible and Infrared Scanner (VIRS) imager, and the Lightning Imaging Sensor (LIS), TRMM aimed to revolutionize rainfall observation.
Operating in a non-sun-synchronous orbit at a 35° inclination, the TRMM satellite has been strategically positioned to sample the diurnal cycle of precipitation over a wide geographic area, a capability not shared by most of the GPM constellation polar-orbiting sensors which typically acquire observations at fixed local times.
Moreover, this orbit enables to obtain coincident measurements with other PMW sensors within the GPM Constellation. Consequently, this allows for the use of the TMI as a common radiometric reference standard for intersensor calibration across the full range of microwave frequencies present in the GPM Constellation of microwave radiometers during the TRMM era. This calibration process improves the consistency and quality of derived precipitation estimates.
The combined use of PR and TMI significantly enhanced rainfall estimation accuracy over the tropics and subtropics. Moreover, PR provided unprecedented insights into the three-dimensional structure of cyclones over the ocean, as well as rainfall characteristics of the Madden-Julian Oscillation and other climate phenomena such as El Niño and La Niña.
The success of the TRMM mission underscored the potential of satellite remote sensing in advancing our understanding of Earth’s water cycle and improving weather forecasting capabilities.
TRMM PR#
The TRMM Precipitation Radar (PR) is a Ku-band (13.6 GHz) cross-track scanning radar with a swath coverage of 215 km. The PR accurately quantifies heavier rainfall in the tropics and the subtropics, but lacks of sensitivity to detect light precipitation and drizzle.
If you plan to use PR measurements, it’s essential to consider the satellite orbit boost (from 350 km to 402.5 km) occurred in August 2011 to extend the satellite lifetime. Following the boost, the swath coverage has widened to 220 km but the spatial resolution of PR footprints has increased from 4.3 km to 5 km and the PR sensitivity has reduced by more than 1 dBZ.
Please note that PR routine operations has ended on October 7th, 2014, although PR data are still available till January 15th, 2015 while TRMM descended to the decommissioning altitude of 335 km.
TRMM TMI#
The TRMM Microwave Imager (TMI) is a passive microwave, dual-polarization conically scanning radiometer equipped with 9 channels. ranging from 10.7 GHz to 85.5 GHz (the 21.3 GHz has only single polarization). The TMI has a swath coverage of 760 km and a spatial resolution ranging between 5 and 37 km at 85.5 and 10.65 GHz respectively.
Build upon the highly successful Special Sensor Microwave/Imager (SSM/I) sensors onboard of the Defense Meteorological Satellite Program (DMSP) satellites, TMI has an additional 10.7 GHz channel and an improved spatial resolution (due to the lower flying altitude).
If you plan to use TMI measurements, it’s essential to consider the satellite orbit boost (from 350 km to 402.5 km) occurred in August 2011 to extend the satellite lifetime. Following the boost, the swath coverage has widened and the instantanoues field of view of each channel has enlarged.
GPM Core Observatory#
The GPM Core Observatory (GPM-CO) satellite, a joint collaboration between NASA and JAXA, was launched on February 28, 2014, building upon the legacy of the TRMM to extend precipitation measurement capabilities from the tropics to higher latitudes (68°N/S).
Equipped with advanced instruments such as the Dual-frequency Precipitation Radar (DPR) and the GPM Microwave Imager (GMI), the GPM Core Observatory can accurately measure a wide range of precipitation types, from light rain and snowfall to heavy tropical rainstorm.
Operating in a non-sun-synchronous orbit at a 65° inclination, the GPM Core Observatory is strategically positioned like TRMM to sample the diurnal cycle of precipitation over a wide geographic area, a capability not shared by most of the GPM constellation polar-orbiting sensors which typically acquire observations at fixed local times.
Moreover, this orbit enables to obtain coincident measurements with other PMW sensors within the GPM Constellation. Consequently, this allows for the use of the GMI as a common radiometric reference standard for intersensor calibration across the full range of microwave frequencies present in the GPM Constellation of microwave radiometers. This calibration process improves the consistency and quality of derived precipitation estimates.
The video here below provides an nice overview of the GPM Core Observatory satellite.
GPM DPR#
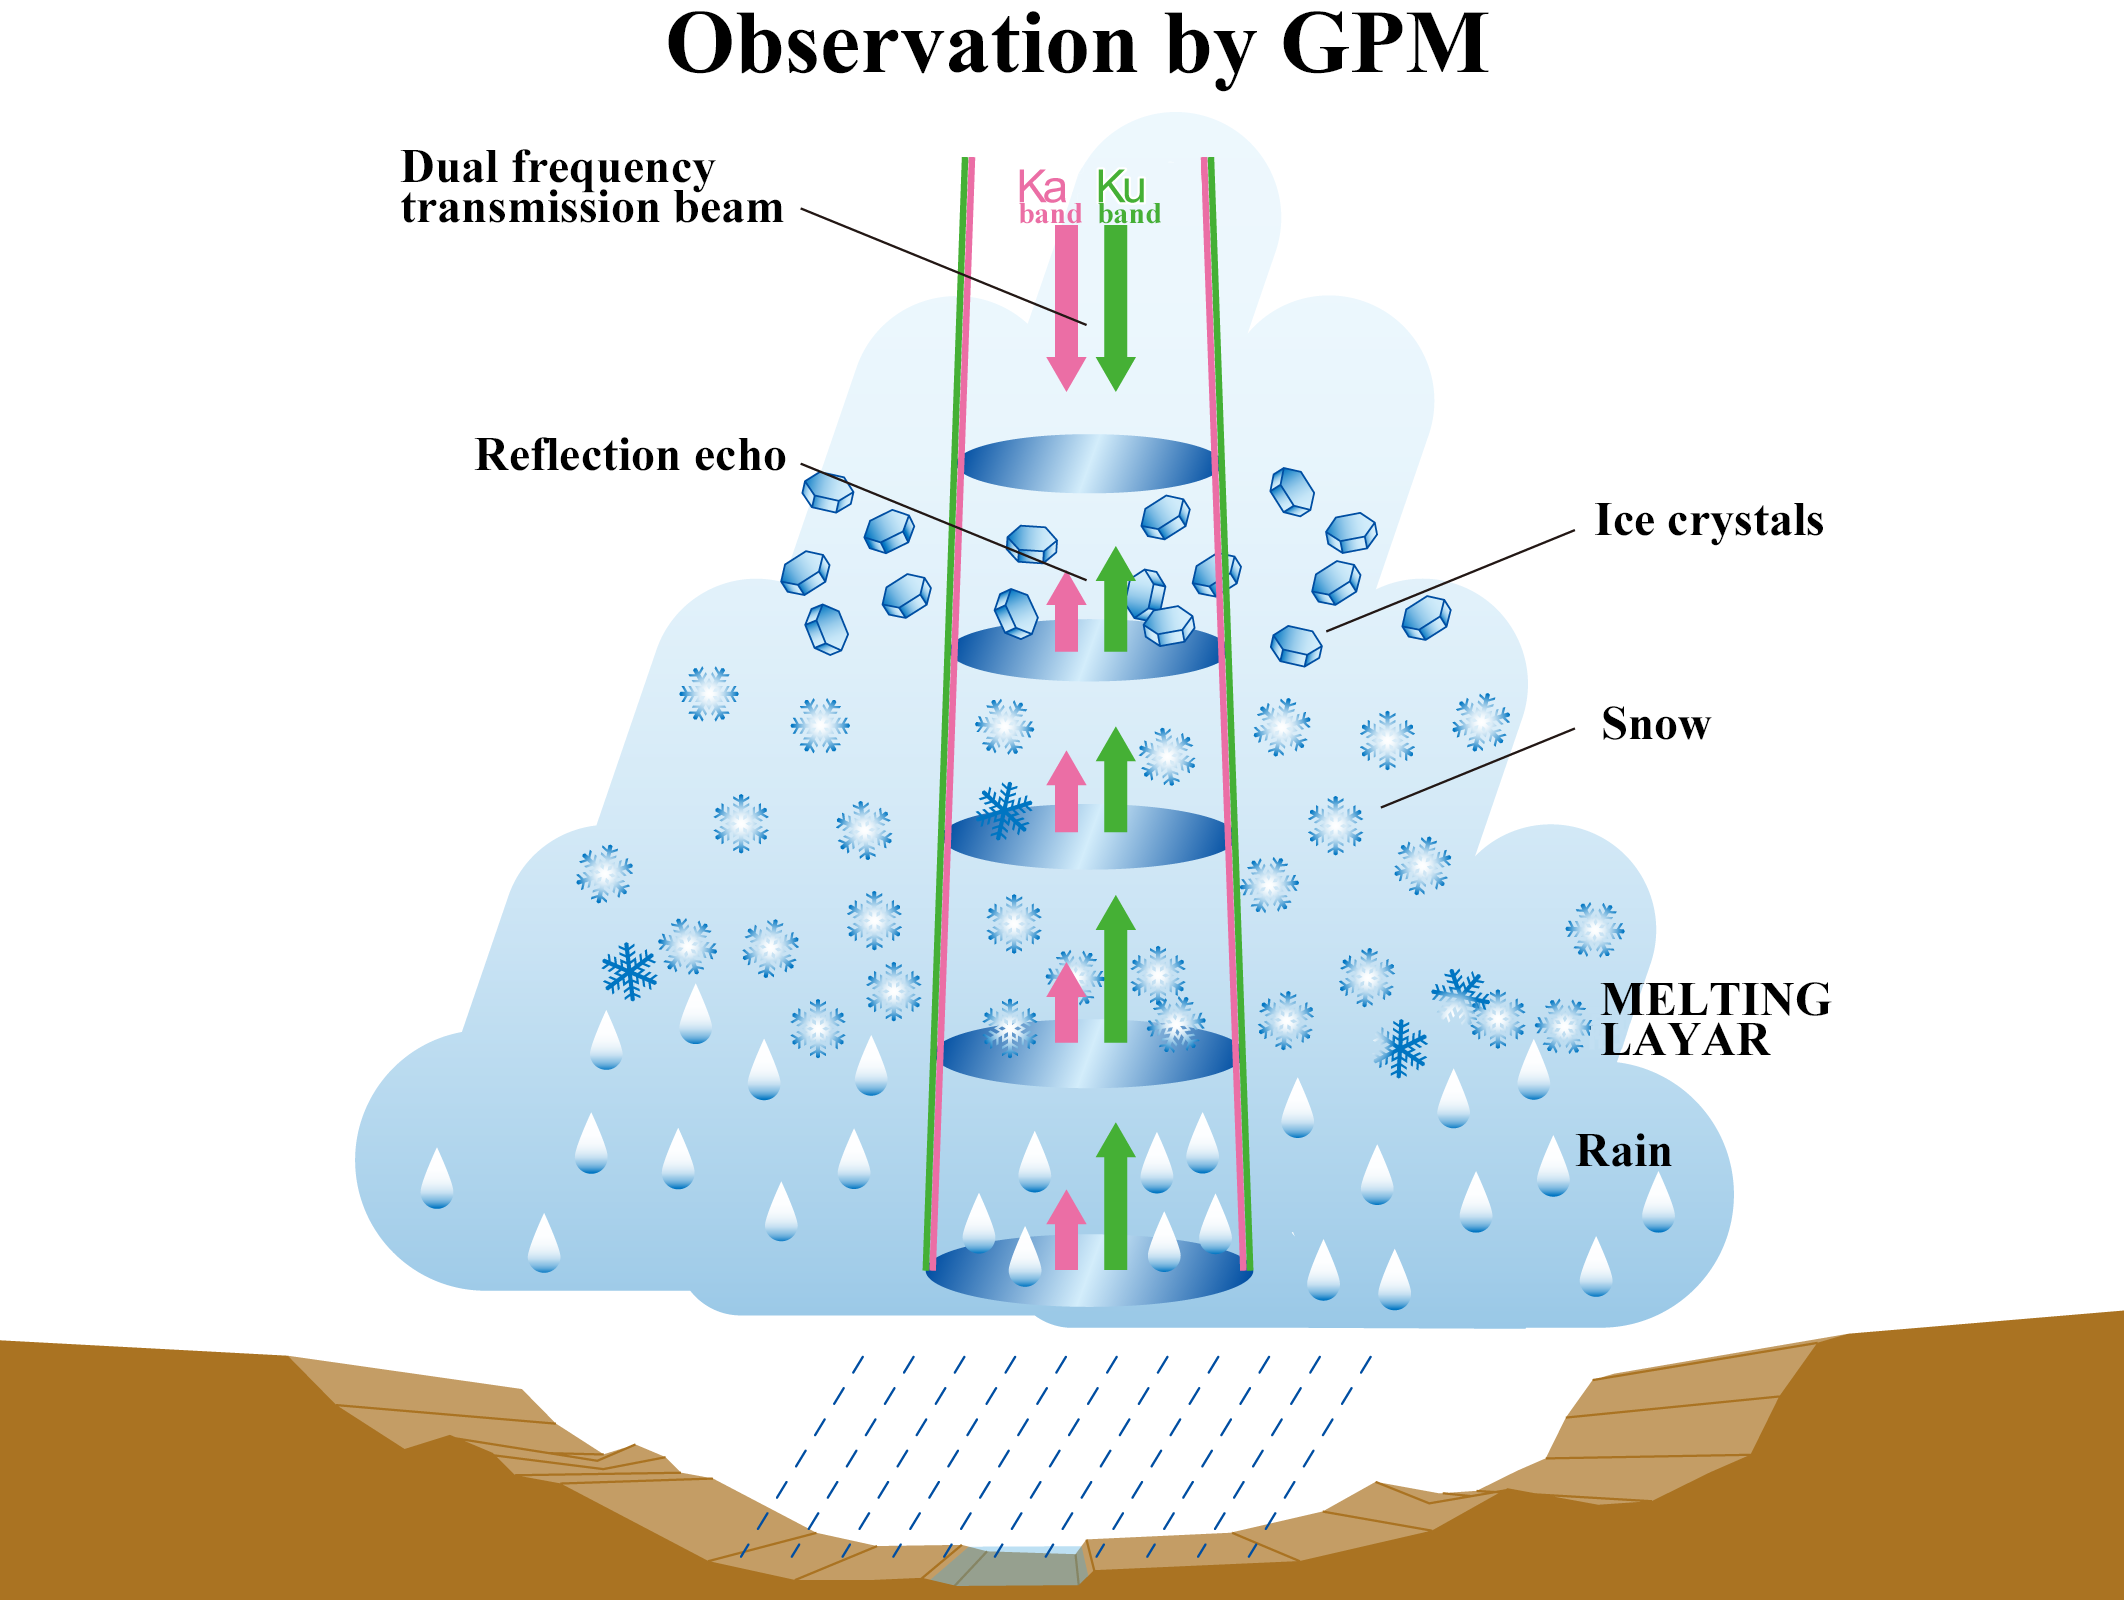
The GPM Dual-frequency Precipitation Radar (DPR) features a Ka-band precipitation radar (KaPR) operating at 35.5 GHz and a Ku-band precipitation radar (KuPR) at 13.6 GHz.
While the KaPR instrument has been designed to detect weak rainfall and snowfall beyond the KuPR’s sensitivity, the KuPR excels at quantifying heavier rainfall and extends the long-term record of TRMM PR in the tropics and the subtropics.
Together, KaPR and KuPR enable three-dimensional dual-frequency observations of precipitation structures and accurate measurement across precipitation types. This capability spans from heavy rainfall in the tropics to weak rainfall in mid-to-high latitudes and snowfall in high-latitudes.
GPM DPR Overview#
Note, however, that despite its detailed insights into precipitation structure and dynamics, the DPR exhibits low sensitivity to light precipitation and drizzle, resulting in significant portions of the lightest precipitation going undetected.
Nonetheless, its detection capabilities miss only a small fraction of the total rain volume due to the relatively minor contribution from light rain and snowfall. Comparisons with CloudSat measurements revealed that DPR does not detect more than 90% of the snowfall identified by CloudSat and tends to underestimate surface snowfall accumulation. It is worth noting, however, that recent studies have shown advances in reducing surface clutter contamination and improving receiver noise-reducing algorithms, which have led to improved detection of light precipitation.
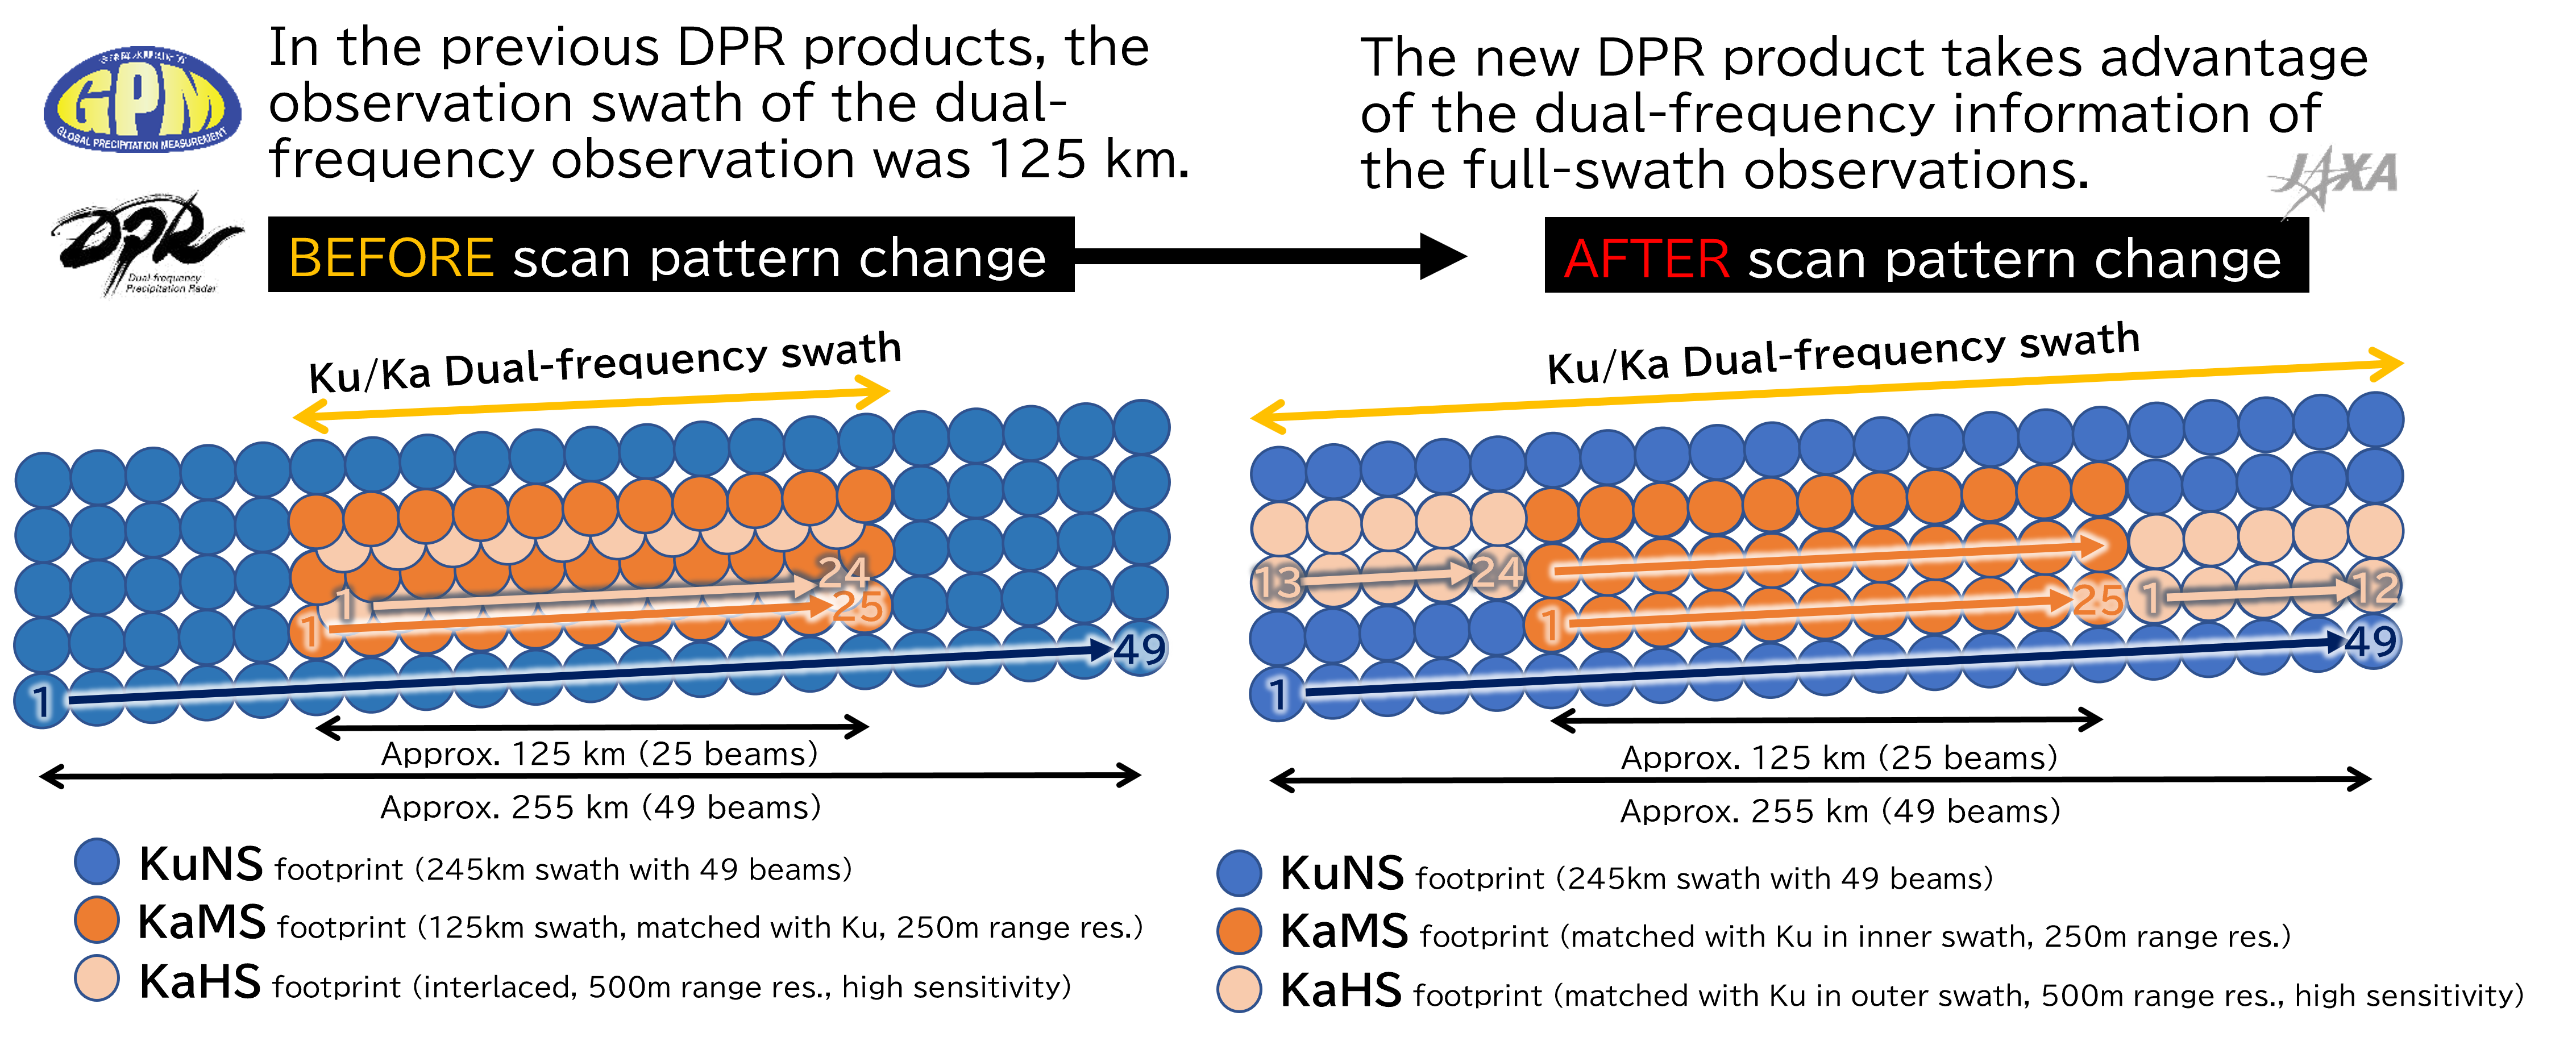
If you plan to analyze or use DPR measurements, it’s essential to consider that the scan pattern of KaPR changed on May 21, 2018.
Prior to the scan pattern change, the dual-frequency information was only available within a narrow inner swath of 125 km. However, after the pattern change, dual-frequency observations are available across the full swath of approximately 245 km.
The figure and video here below illustrate the scan pattern change.
Scan Pattern Before May 21, 2018
Scan Pattern After May 21, 2018
Please also note that the GPM-CO satellite underwent an orbit boost (from 407 km to 442 km) the 7/8 November 2023 to extend the satellite lifetime. Following the boost, the swath coverage has widened to 268 km but the spatial resolution of DPR footprints has increased from 5 km to 5.48 km and the DPR sensitivity has reduced by approximately 0.8-0.9 dBZ.
GPM GMI#
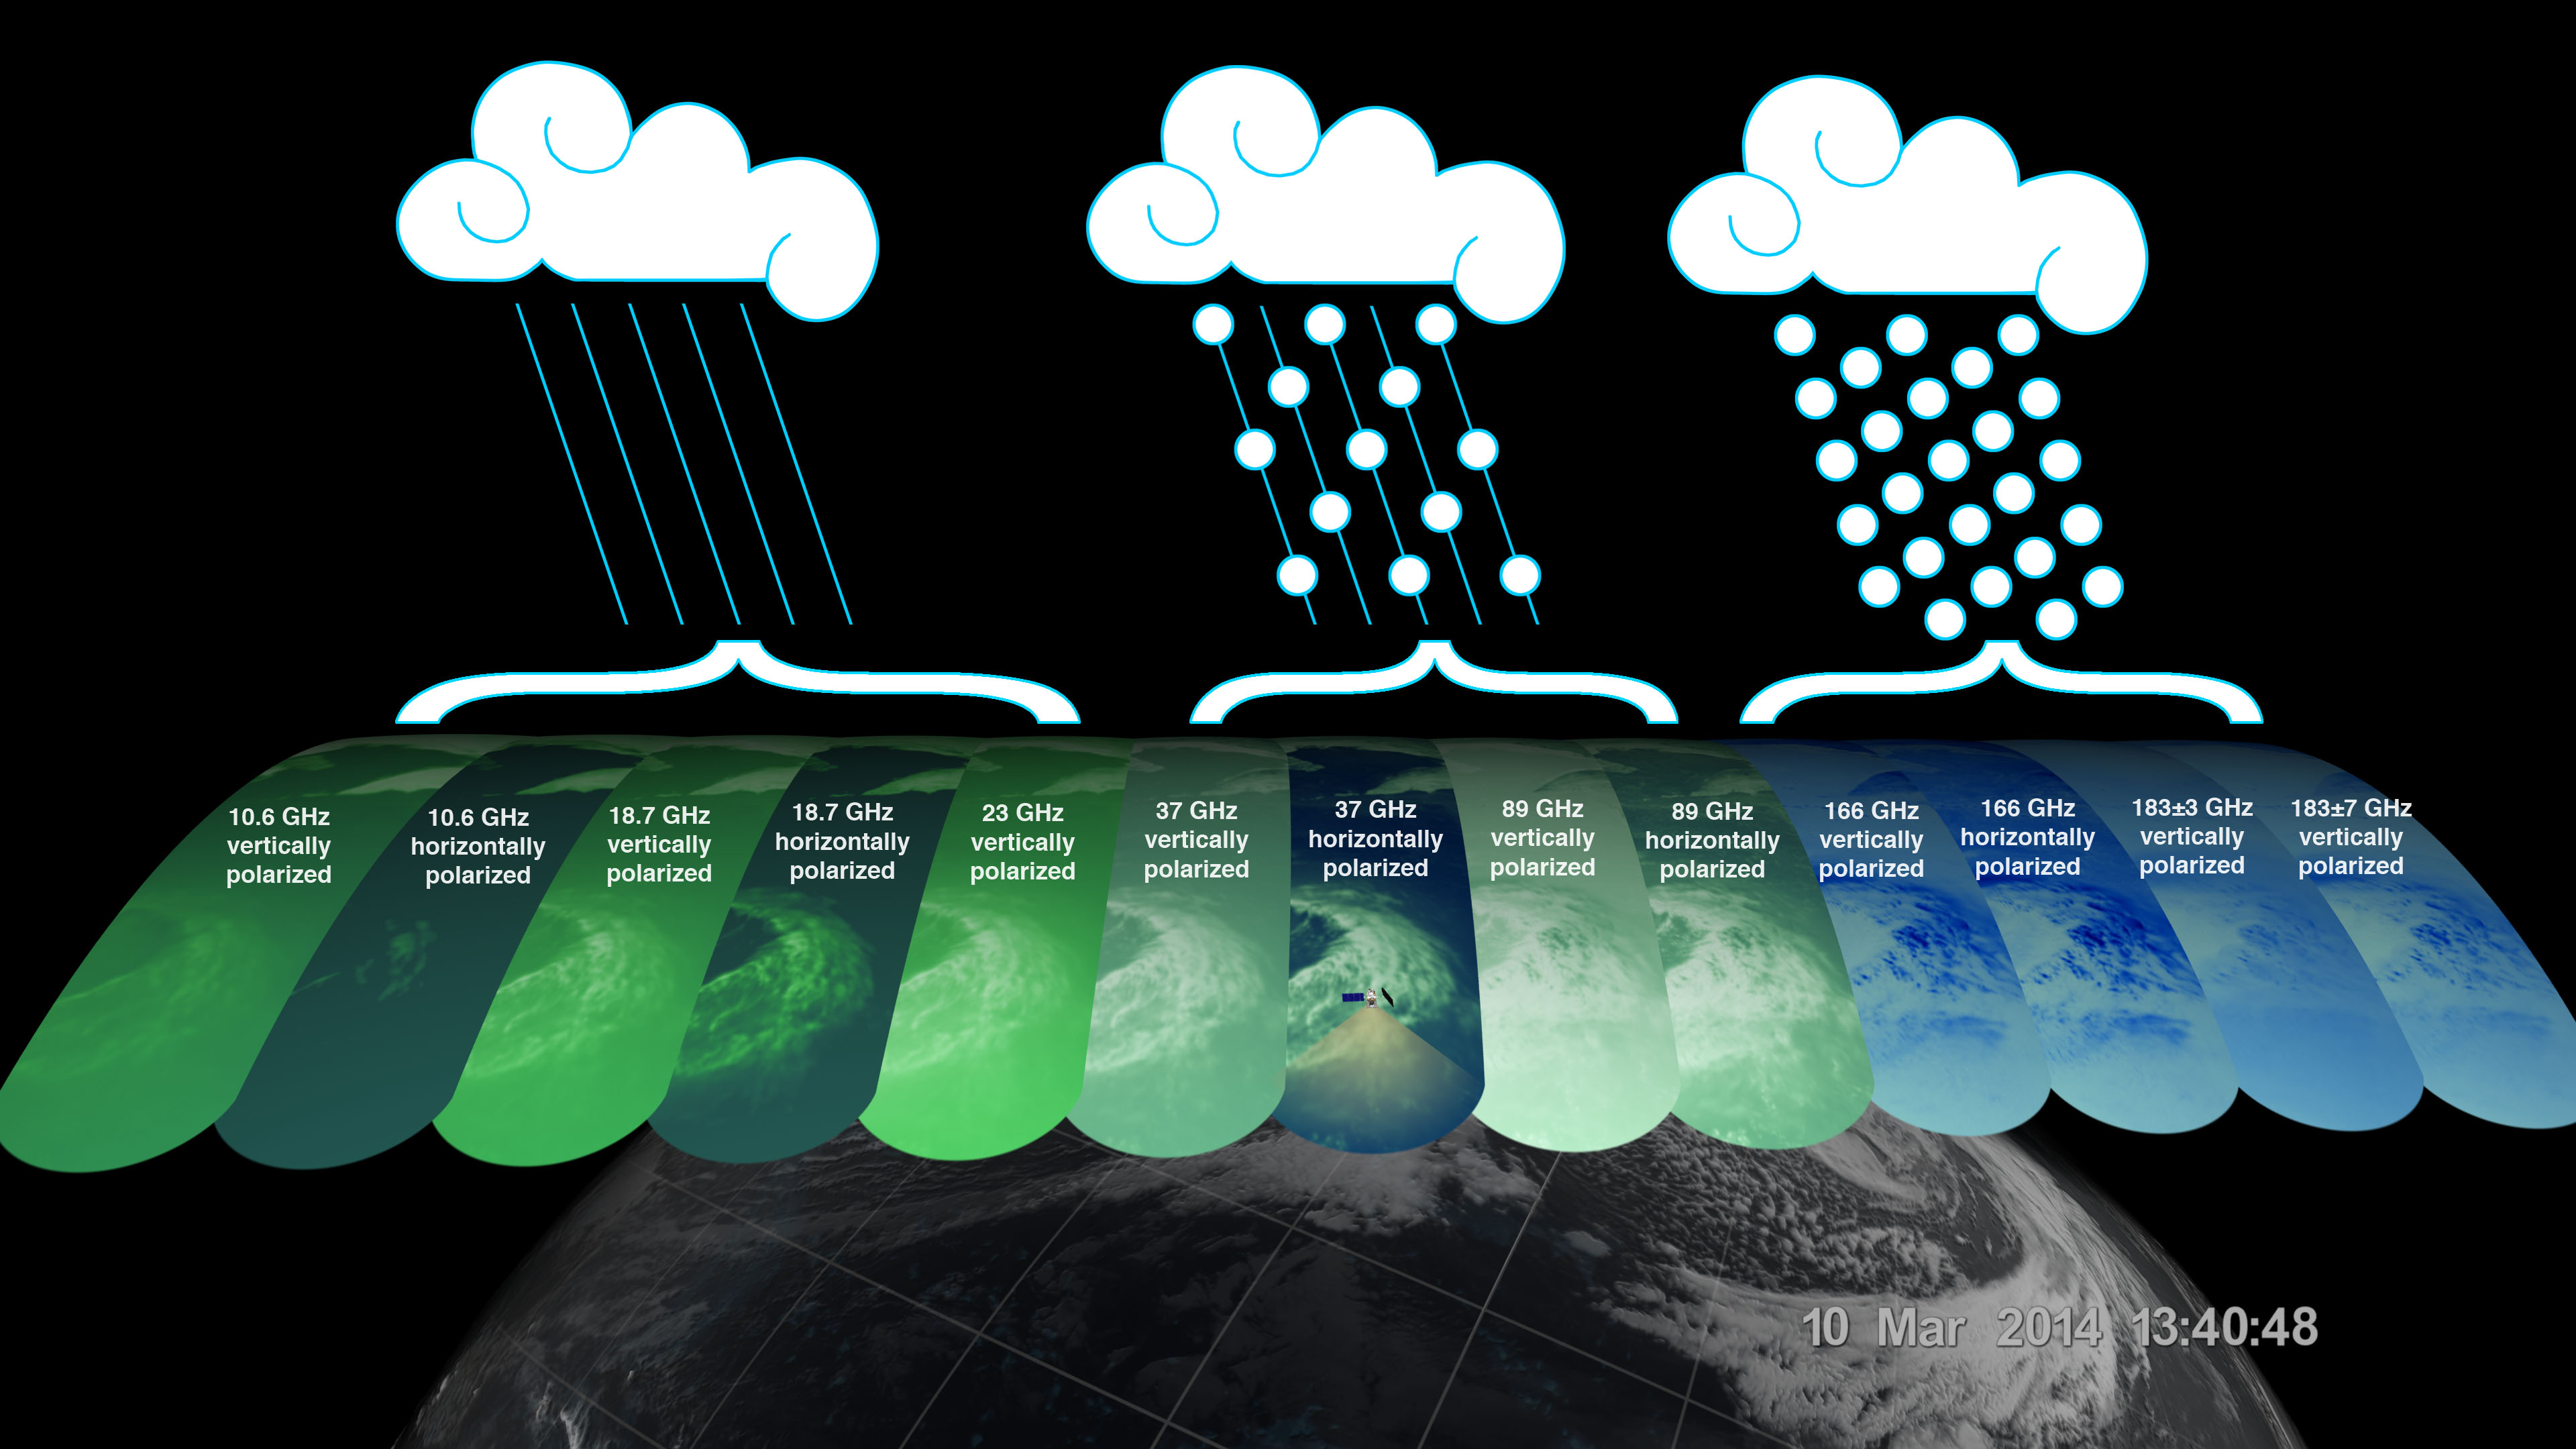
The GPM Microwave Imager (GMI) is a dual-polarization, multi-channel, conical- scanning, microwave radiometer equipped with 13 channels ranging from 10 GHz to 183 GHz.
Compared to the TMI instrument on TRMM, the GMI has an improved spatial resolution and carries 4 additional high-frequency channels near 166 GHz and 183 GHz.
Each channel is sensitive to a different frequency of microwave energy naturally emitted from or affected by precipitation. Lower frequency channels are sensitive to heavy and moderate rainfall, while the high-frequency channels are affected by water vapor and ice particles.
A visual overview of the GMI channels is provided in the figure below:
Overview of the GPM GMI channels#
It’s important to note that the channel footprint size decreases with increasing frequency, and the high-frequency channels are not aligned with the low-frequency channels.
However, the 1C-GMI-R product addresses this issue providing the low-frequency channels collocated with the nearest neighbor high-frequency channels.
Furthermore, it’s worth noting that only the central portion of the GMI swath overlaps the radar swath, with a delay of approximately 67 seconds caused by the spacecraft motion and geometric considerations.
When using GMI measurements, it’s essential to consider the satellite orbit boost (from 407 km to 442 km) occurred the 7/8 November 2023 to extend the satellite lifetime. Following the boost, the swath coverage has widened and the instantaneous field of view of each channel has enlarged.
Data acquired by GMI are used as a reference standard for intercalibrating the passive microwave sensors within the GPM Constellation, ensuring consistency and accuracy in precipitation estimation across multiple satellite platforms.
GPM Constellation#
The GPM Constellation is composed by satellites from various space agencies, each equipped with microwave radiometers. These radiometers operate across a range of frequencies, from 6 to 183 GHz, and include both conical-scanning and cross-track-scanning instruments.
Low-frequency channels have been used for rainfall estimation since the launch of the first SSM/I instrument in 1987. Instead, high-frequency microwave channels which were originally designed for water vapor profiling have proven particularly useful for discerning precipitation in regions with uncertain land surface emissivities, such as frozen and snow-covered areas.
Over the years, the composition of sensors within the constellation has evolved, leading to changes in spatial coverage and sampling frequency. These changes are influenced by the number of operational sensors and their respective orbits.
The operational timeline of the GPM constellation is depicted in the figure below.

It’s important to note that not all existing PMW sensors currently in orbit are part of the GPM constellation. For instance, the constellation does not include 7 Chinese FY-3 Microwave Radiation Imagers (MWRI) and 6 Microwave Humidity Sounders (MWHS), as well as 5 Russian Imaging/Sounding Microwave Radiometers (MTVZA).
The WindSat Polarimetric Microwave Radiometer is also not part of the constellation. Furthermore, recent satellite missions such as TROPICS and TEMPEST, as well as private industry sensors from Tomorrow.io and GEMS, have not yet been integrated into the GPM Constellation.
Additional references to all the PMW sensors can be found in the Useful Resources section at the end of this document.”
The video here below illustrates the precipitation measurements acquired by the GPM constellation sensors over a 3-hour period.
GPM Sensors#
The GPM mission relies on passive and active remote sensing measurements to measure the properties of precipitation. In the following subsections some theoretical fundamentals of spaceborne radars and passive microwave sensors are introduced.
Radars#
Spaceborne radars operate by transmitting microwave signals towards the Earth’s surface and recording the backscattered portion of the signal.
The time delay between the transmitted and reflected signals determines the distance to the atmospheric volume being sensed, known as the radar gate, while the strength of the backscattered signals, known as radar reflectivity, is related to the class, size and concentration of the hydrometeors present in that volume.
This capability allows radars to provide insights into the three-dimensional structure of clouds and precipitation. Because of the direct physical relationship between radar reflectivity and hydrometeor properties, spaceborne radars are able to generate highly accurate precipitation estimates.
The radar frequency governs the sensitivity, the electromagnetic scattering regime and the degree to which the radar signals are attenuated within clouds and precipitation. For instance, detecting cloud droplets and light precipitation requires high microwave frequencies, such as W and Ka bands, respectively. On the other hand, observing intense precipitation cores necessitates lower frequencies, like the Ku band, which are less affected by the attenuation caused by high concentrations of large hydrometeors.
The use of spaceborne radar measurements necessitates addressing several critical factors, including attenuation, surface clutter, minimum detectable signal, and non-uniform beam filling.
Attenuation: When radar signals propagate through the atmosphere, they interact with various atmospheric constituents such as water vapor, clouds, and precipitation particles. Attenuation refers to the weakening of a radar signal as it moves further away from the emitter and is scattered, reflected, and absorbed by precipitation and other atmospheric particles. Correcting for attenuation effects is crucial for accurate precipitation estimation, as it directly affects the strength of the received radar signal and, consequently, the estimation of hydrometeor properties.
Surface Clutter: Surface clutter occurs when radar signals reflect off the Earth’s surface, potentially masking precipitation echoes, particularly in mountainous terrain and within the first 2000 km of the atmosphere.
Minimum Detectable Signal: The minimum detectable signal represents the weakest radar signal that the system can reliably discern above background noise levels. This threshold is influenced by factors such as the radar’s sensitivity, the system’s noise characteristics, and the presence of interfering signals. In regions with low signal-to-noise such as distant or weak precipitation echoes, detecting meaningful radar returns is challenging.
Non-uniform Beam Filling: Non-uniform beam filling occurs when the radar beam encounters hydrometeors of varying sizes and concentrations within its footprint. As a result, the received radar signal may represent an average of different hydrometeor populations, leading to uncertainties in estimating precipitation intensity and distribution.
Compared to passive microwave sensors, spaceborne radars, especially those operating at Ku and Ka bands, are less influenced by atmospheric gases like water vapor and are unaffected by surface microwave emissions.
PMW#
Passive microwave (PMW) sensors lack ranging capabilities like radars, such as determining the distance to precipitation particles. Instead, they measure upwelling microwave radiation at the top of the atmosphere within their Field Of View (FOV). This integrated signal depends on various factors including surface temperature and emissivity, as well as the temperature, absorption/emissivity, and scattering properties of precipitation, clouds, and atmospheric gases.
When interpreting PMW measurements, it’s crucial to consider atmospheric conditions (clear-sky vs. non-precipitating clouds and precipitating clouds) and distinguish between channel types (window vs. absorption bands) and microwave frequency (low vs. high). Furthermore, lower microwave frequencies correspond to channels with lower spatial resolution, complicating signal interpretation due to spatial variability within the FOV.
Sensors utilizing window channels are termed “imagers” (e.g., TMI, SSMI, AMSR-E, ASMR2), while those using absorption channels are termed “sounders” (e.g., MHS, SAPHIR, ATMS). Nowadays, many satellites carry sensors with both imaging and sounding capabilities (e.g., SSMI/S, GMI) to exploit channel synergies.
When selecting microwave frequencies for passive atmospheric sounding, it’s necessary to ensure that the chosen frequencies are sensitive enough to detect the desired atmospheric properties, such as humidity, while also guaranteeing that the signal can penetrate through the atmosphere to the required altitude without being excessively absorbed or becoming saturated. This concept of penetration refers to the microwave signal’s ability to travel through the atmosphere and reach the satellite sensor after being emitted by the Earth’s surface or atmospheric constituents.
Absorption/sounding channels focus on sensing signals primarily from atmospheric gases, such as water vapor and oxygen, and measure around their absorption lines. These lines represent specific frequencies at which atmospheric gases strongly absorb microwave radiation. For instance, oxygen absorption is significant at frequencies such as 50-60 GHz and 118 GHz, whereas water vapor absorption is notable at frequencies like 22.235 GHz and 183 GHz. These channels are particularly useful for profiling atmospheric temperature and humidity, respectively.
The observed brightness temperature (BT) in these channels correlates with the dryness or warmth of the air mass.
On the other hand, window channels predominantly capture signals from the Earth’s surface and precipitation. They are less affected by atmospheric absorption compared to the absorption channels. Window channels operate across various frequencies, including 6-7 GHz, 10-11 GHz, 18.7 GHz, 23-24 GHz, 31.4 GHz, and 36-37 GHz.
Notably, channels around 89 GHz and 150-165.5 GHz, while still considered “window” channels, exhibit increased sensitivity to atmospheric conditions, particularly regarding water vapor, cloud water content, and ice particles.
In clear-sky conditions, window channels can directly observe the surface. In cloudy conditions, they still detect surface signals, but lower frequencies have a better ability to penetrate through the atmosphere, providing valuable insights into atmospheric conditions even in the presence of clouds.
For clear-sky and non-precipitating clouds, dominant properties include absorption/emission and transmission. In non-precipitating clouds, with small cloud droplets, scattering is negligible. However, microwave scattering becomes relevant with frequencies above 50 GHz in the presence of ice particles.
Using sounding sensors to estimate precipitation relies on detecting the scattering signature of ice particles with high-frequency channels, while imaging sensors exploit low-frequency channels to capture microwave emission from raindrops, and middle to high frequency channels to capture the scattering signature of ice particles.
In intense precipitating clouds, scattering is the dominant property. Microwave scattering, known as the microwave depression, occurs due to ice particles reflecting upwelling microwave radiation back to the surface, thereby reducing the observed brightness temperature from space. Scattering signatures are highly sensitive to the size distribution, shapes, and densities of ice particles.
Over the ocean, the contrast between cold water surface and warmer raindrops enables the identification of precipitation using low-frequency channels. However, over land, this contrast is minimal. Middle and high frequencies (e.g., 89 GHz and 183 GHz) are utilized to detect BT depressions caused by ice particle scattering against the warm land background.
It’s important to note that unlike infrared radiation, which is strongly tied with an object’s temperature, the emitted microwave radiation is governed by the object’s physical properties (which controls the microwave emissivity).
The figure below displays the BTs sensed by GMI Hurricane Ida’s landfall on August 29, 2021, at 15:13:00 UTC. Please note the BT depression over land in the high frequency channels, and the higher BT in the lower frequency channels over the ocean.

GPM Data Archive#
GPM-API provides tools to easily search files on the Precipitation Processing System (PPS) and the Goddard Earth Sciences Data and Information Services Center (GES DISC) data archives and to download them to your local machine. However, the PPS and GES DISC data archives can also be explored on your browser.
The following links provide access to the data archives:
GES DISC TRMM Data: https://disc2.gesdisc.eosdis.nasa.gov/data
GES DISC GPM Data: https://gpm1.gesdisc.eosdis.nasa.gov/data
PPS Research Data: https://arthurhouhttps.pps.eosdis.nasa.gov/
PPS Near-Real-Time Data: https://jsimpsonhttps.pps.eosdis.nasa.gov/text/
Please note that the Near-Real-Time (NRT) products are available only on the PPS and for a limited time period, typically 5-6 days.
An exception occurs for the IMERG Early Run and Late Run products which are available over
the entire TRMM/GPM timespan both on PPS and GES DISC data archives.
The Research (RS) products are instead available on both the PPS and GES DISC with a delay of 2-3 days from NRT.
The Japanese JAXA G-Portal facilitates the retrieval of additional data, including the L2 products of AMSR and AMSR-E as well as the GSMaP global precipitation estimates.
Similarly, the Chinese FengYun Satellite Data Center provides access to the PMR, MWRI, and MHWHS sensor products.
The GPM-API does not currently support methods for searching, downloading, and opening products from JAXA and FengYun data centers, but contributions to expand the GPM-API to include these data centers are very welcome !
GPM Product Levels#
Satellite data are available in different levels of processing.
Level 1A products provide the unprocessed raw sensor data.
Level 1B products provide the geolocated and radiometrically corrected radar and PMW sensor data.
Level 1C products provides the inter-calibrated PMW brightness temperatures used for generating the L2 PMW products.
Level 2A products contains the geophysical parameters derived from individual sensors.
Level 2B products contains the geophysical parameters derived from combined DPR/GMI or PR/TMI sensors.
Level 3 gridded products results from the temporal and spatial aggregation of the L2 products.
Currently, the GPM-API provide access to the IMERG products and all L1 and L2 GPM products. L3 products are currently not available via GPM-API, but can be manually computed using the Geographic Bucket Toolbox provided by the software.
You can retrieve the list of products available through the GPM-API using the gpm.available_products() function.
For a comprehensive online list of GPM products, refer to this page
and the STORM page.
It’s important to note that GPM products are available in different versions. Currently, GPM-API offers access to versions 5, 6, and 7. Version 7 is the latest and is recommended for most applications.
The Level 1A and 1B products are computed by each sensor’s provider, while Level 1C PMW products are computed at PPS. Currently, only Level 1A and 1B products for TRMM and GPM sensors are available.
While analyzing a GPM product, it is recommended to consult the corresponding Algorithm Theoretical Basis Document (ATBD) and the GPM Products File Specification, for detailed information on product variables and their attributes.
GPM Products#
In the following subsections the different types of GPM products are presented.
Radar Reflectivity#
Radar reflectivity measurements from PR and DPR are available in the L2A products.
Use gpm.available_products(category="RADAR", product_levels="2A") to list the available products.
PMW Brightness Temperature#
Brightness temperature measurements from the PMW sensors within the GPM constellation are available in the L1B and L1C products.
The L1B product provide the raw brightness temperature measurements, while the L1C product provides the inter-calibrated brightness temperatures.
Use gpm.available_products(category="PMW", product_levels="1C") to list the available products.
Radar Precipitation#
TRMM PR is a Ku-band radar and thus lack the sensitivity to detect drizzle and light precipitation. The GPM DPR addresses this limitation with an additional Ka-band, offering improved sensitivity to lighter rain and falling snow.
However, radar signals reflected by snowfall and light precipitation often fall below the minimum detectable signal and goes undetected. Nonetheless, the GPM DPR miss only a small fraction of the total rain volume due to the relatively minor contribution from light rain and snowfall.
Spaceborne radars cannot rely on a simple Z-R relationship for precipitation estimation due to the absence of a global Z-R relationship valid for all precipitation types. Instead, they utilize complex inversion algorithms to retrieve the hydrometeor distribution within each radar gate, accounting for factors like signal attenuation and non-uniform beam filling.
The following video nicely illustrates the importance of understanding and accurately predict the hydrometeor size distribution.
For further insight into spaceborne radar functionality and associated challenges, please refer to the Radar section.
For a comprehensive understanding of the theoretical and mathematical foundations of the radar retrieval algorithm please refer to the DPR ATBD.
Precipitation estimates derived from PR and DPR are available in the L2A products.
Use gpm.available_products(category="RADAR", product_levels="2A") to list the available products.
Please note that the intensity of instantanouos precipitation rate estimates is currently capped at 300 mm/hr !
PMW Precipitation#
A PMW sensor measures, at specific frequencies, the outcoming top of the atmosphere (TOA) microwave radiation within the instrument field of view (FOV). This radiation arises from the natural reflection and emission of the Earth’s surface and by its gaseous, liquid, and solid atmospheric constituents.
The signal sensed by PMW sensors is therefore an integrated measure of a complex interplay of processes occurring in the atmospheric column, which make the precipitation retrievals notoriously difficult.
When the surface emissivity can be estimated accurately (i.e. over the oceans), the difference from the observed TOA microwave radiation at specific microwave bands can be exploited to obtain a reasonable estimate of the rain rate. However, over land and ice-covered surfaces where modeling surface emissivity is more challenging, the uncertainty in the precipitation retrievals increases substantially. Additionally, over snow-covered terrain, it’s very hard to disentangle the scattering and emission signature of the snow in the air from the signature of snow on the ground.
The Goddard Profiling Algorithm (GPROF) is used to retrieve precipitation estimates from all PMW sensors of the GPM constellation. GPROF use a Bayesian inversion technique in conjunction with a-priori database to constrain the candidate solutions based on auxiliary model-based parameters such surface temperature, surface type and total column water vapor. This a-priori database is build using observed DPR precipitation profiles and their associated brightness temperature signals.
For a comprehensive understanding of the theoretical and mathematical foundations of the GPROF algorithm please refer to the GPROF ATBD.
Precipitation estimates derived from GPM Constellation sensors are available in the L2A products.
Use gpm.available_products(category="PMW", product_levels="2A") to list the available products.
Please note that the intensity of instantanouos precipitation rate estimates is currently capped at 80 mm/hr !
CORRA Precipitation#
The Combined Radar-Radiometer Algorithm (CORRA) use TMI/GMI multichannel radiometric measurements as additional integral constraints on PR/DPR retrieval algorithms. The combined use of coincident active and passive microwave sensor data offers complementary information about the macro and microphysical processes of precipitating clouds which can be used to reduce the under constrained nature of the inversion problem. In simple terms, the combined algorithms use the radiometer signal as a constraint on the attenuation seen by the radar or to counterbalance the lack of sensitivity of the radar to light precipitation.
CORRA produce a set of geophysical parameters, including hydrometeor profiles, particle size distributions, and surface parameters, that are physically consistent with both radar reflectivity profiles and brightness temperature radiometer measurements over the radar swath.
The TRMM/GPM CORRA product can be accessed with GPM-API using the 2B-TRMM-CORRA and 2B-GPM-CORRA product acronyms.
For the theoretical and mathematical details of the combined radar/radiometer algorithm please refer to the CORRA ATBD.
Please note that the intensity of CORRA instantanouos precipitation rate estimates is currently capped at 80 mm/hr !
IMERG Precipitation#
The Integrated Multi-satellite Retrievals for GPM (IMERG) is an advanced algorithm designed to generate a high resolution precipitation product every 30 minutes, covering the full globe (up to version 6, a quasi-global area from 60°S to 60°N) with a spatial resolution of 0.1° x 0.1°. The latest IMERG product covers the time period from January 1998 to present.
By leveraging measurements from Geostationary (GEO) IR imagers and the GPM PMW sensors constellation, IMERG provides a “best-estimate” of 30-minute average precipitation rates.
IMERG generates three distinct precipitation products.
The IMERG Early (IMERG-ER) product is available 4 hours after real-time, followed by IMERG Late (IMERG-LR) after 14 hours.
The final product version, IMERG Final (IMERG-FR), is released approximately 3.5 months later.
The 4-hour and 14-hour delays for Early and Late products are necessary to gather and process satellite measurements from various space agencies. The 3.5-month delay for the Final product enables the incorporation of rain gauge data from the Global Precipitation Climatology Centre (GPCC) and the application of bias correction to refine the satellite-based precipitation estimates.
In the design of IMERG, a significant challenge is the scarcity of direct measurements from the GPM constellation in most grid cells within any 30-minute period. To fill these spatial and temporal gaps left by PMW satellites, IMERG exploits storm system motion vectors and precipitation estimates derived from GEO IR measurements.
Storm system motion vectors enables the backward and forward propagation, or “morphing,” of available PMW-derived precipitation measurements across the grid. While IMERG Early uses only forward propagation in time (extrapolation in time), IMERG Late benefits form from both forward and backward propagation (interpolation in time).
When PMW data are too sparse, IMERG incorporates precipitation estimates derived from GEO IR imagery through a weighted Kalman filter.
IR-based precipitation estimates are derived from the NOAA Climate Data Record (CDR) of Gridded Satellite Data from the ISCCP B1 (GridSat-B1) IR dataset for all timesteps between January 1998 and February 7, 2002, 20:00:00 UTC. Starting from February 7, 2002, 20:00:00 UTC, IR-based precipitation estimates are obtained from the NOAA Climate Prediction Center (CPC) Merged 4-km Global IR data product.
This dataset composites infrared (IR) brightness temperature measurements from numerous geostationary sensors over their operational periods, including European (METEOSAT-5/7/8/9/10/11), Japanese (GMS-5, MTSat-1R/2, Himawari-8/9), and U.S. (GOES-8/9/10/11/12/13/14/15/16/17/18) satellites, every 30 minutes between 60°N/S.
IR-based precipitation estimates are obtained using the PERSIANN-CSS algorithm (up to IMERG V6) and the PDIR-NOW algorithm (IMERG V7). However, these estimates have lower accuracy compared to PMW measurement due to the indirect relationship between infrared cloud top temperature (sensed by the IR imagers) and surface precipitation.
It’s worth noting that the source of storm system motion vectors has evolved across different IMERG versions: V5 derived motion vectors from the sequence of GEO IR imagery, V6 transitioned to using NWP/reanalysis-based total precipitable water vapor (TPWWV) fields, and V7 employs a combination of NWP/reanalysis-based precipitation, total precipitable liquid water (TPLW) and TPWWV.
For more information on IMERG, including theoretical and algorithmic details, please refer to the ATBD of IMERG version 6 and IMERG version 7.
The following two videos show global precipitation patterns revelead by IMERG.
Scan Pattern Before May 21, 2018
Scan Pattern After May 21, 2018
Latent Heating#
Latent heating refers to the release or absorption of heat energy during phase changes of water within the Earth’s atmosphere.
When water vapor condenses into liquid droplets or solid ice crystals, as in the formation of clouds and precipitation, it releases latent heat into the surrounding atmosphere. This latent heat, often referred to as “latent heat of condensation” is a primary driver of large- and small-scale atmospheric circulations. Conversely, when liquid water evaporates into vapor, or solid ice melt to liquid water or sublimates directly into vapor, heat energy is absorbed from the surrounding environment. This absorption of latent heat is an essential component of the water cycle and contributes to the redistribution of energy within the atmosphere.
Estimates of the heat released or absorbed at various altitudes are crucial to improve global atmospheric circulation models and can also be assimilated operationally into numerical weather forecasts to constrain the initial conditions of the models.
Two algorithms, the Goddard Convective-Stratiform Heating (CSH) and the Japanese Spectral Latent Heating (SLH), are employed for retrieving latent heating estimates from TRMM/GPM measurements. The SLH algorithm requires only radar data, while CSH make use of the joint PR/TMI and DPR/GMI measurements.
Both algorithms are built upon pre-computed look-up tables derived from simulations from cloud-resolving models (CRMs) such as the Goddard Cumulus Ensemble model (GCE) and regional-scale models like the NASA Unified Weather Research and Forecasting model (NU-WRF) and the Japan Meteorological Agency’s Local Forecast Model (LFM).
The TRMM/GPM SLH and CSH products can be accessed with GPM-API using the 2A-TRMM-SLH, 2B-TRMM-CSH, 2A-GPM-SLH, 2B-GPM-CSH product acronyms.
For a recent overview of CSH and SLH products, please refer to Tao et al., 2022 and Shige et al., 2009 respectively.
Coincidence Datasets#
In the following subsections some of the coincidence satellite datasets available within the TRMM and GPM era are presented. None of the following datasets is currently supported by GPM-API but we welcome contributions to expand the software capabilities.
AMSR-E - CloudSat#
The A-Train Constellation is a group of satellites (including Aqua, CloudSat, CALIPSO, and Aura) that closely followed one another along the same orbital track.
This allowed near-simultaneous observations from a wide variety of instruments that can be synergistically used to further our understanding of the Earth’s atmosphere and surface.
The A-Train Constellation between 2006 and 2011 provided the quasi-simulaneous acquisitions of the 94-GHz (W-band) CloudSat Profiling Radar (CPR) and the 12-channel (6.925 - 89 GHz) Advanced Microwave Scanning Radiometer for EOS (AMSR-E).
The ASMR2-AUX dataset contains a subset of ancillary AMSR2 surface precipitation and ocean products data collocated with each CPR footprints, while the AMSRERR_CPR_002 dataset provides only the AMSR-E derived rain rate.
The AMSR-E - CloudSat dataset is particularly useful for developing and validating PMW-based precipitation retrieval algorithms using CloudSat CPR data as a reference.
GPM - CloudSat#
The TRMM/GPM-CloudSat Coincidence dataset collects satellite acquisitions (intersections) occurring within a small time window between the TRMM/GPM-CO satellites and the 94-GHz (W-band) CloudSat Profiling Radar (CPR).
These coincidences yield combined dual/triple-frequency radar profiles, incluuding W-band from CPR and:
the GPM DPR Ku/Ka-band reflectivites along with the brightness temperatures from the 13-channel (10-183 GHz) GMI radiometer.
the TRMM PR Ku-band reflecitvity along with the brightness temperatures from the 9-channel (10-89 GHz) TMI radiometer.
Additionally, the dataset also includes collocated thermal and near-infrared measurements from the Moderate Imaging Spectroradiometer (MODIS) imager onboard the Aqua satellite (channels 20 and 27-36).
This dataset serves various scientific purposes, including algorithm evaluation and development, identification of deficiencies, studies on snow and light rain sensitivity, exploration of cloud processes, radiative transfer simulations, and examination of land surface effects on radar, radiometer, or combined-sensor precipitation retrieval algorithms.
For detailed information on the TRMM/GPM-CloudSat Coincidence dataset, please refer to the corresponding journal article and the Algorithm Theoretical Basis Document (ATBD).
The TRMM/GPM-CloudSat Coincidence dataset V5 can be downloaded with GPM-API using the 2B-GPM-CSAT and 2B-TRMM-CSAT product acronyms.
The figure below displays a quick-look radar time-height profile imagery from the GPM - CloudSat Coincidence dataset.

GPM - GLM#
The GPM-GLM dataset collocates data from the Geostationary Lightning Mapper (GLM) instruments onboard of the geostationary satellites GOES-16, GOES-17 and GOES-18 onto the GPM-DPR swath track. This dataset will expand the lightning record from the TRMM-LIS into the GPM era.
Warning
SOON AVAILABLE
GPM - GEO#
The GPM-GEO dataset collocates data acquired from the third-generation of geostationary VIS/IR imagers onto the GPM-DPR swath track. The dataset currently includes L1 (radiances) and L2 (precipitation estimates and cloud properties) derived from the Advanced Baseline Imager (ABI) (onboard of GOES-16, GOES-17, GOES-18 satellites) and from the Advanced Himawari Imager (AHI) (onboard of Himawari-8 and Himawari-9 satellites).
Warning
SOON AVAILABLE
Features Database#
In the following subsections several “feature” database derived from the TRMM and GPM sensors are described. While these datasets are not currently supported by the GPM-API, we welcome contributions to expand the software capabilities.
TAMU-CC Precipitation Features#
Pioneered by Nesbitt et al. in 2000 and further formalized by Liu et al. in 2008, this database includes Precipitation Features(PFs) derived from TRMM (PR, TMI, VIRS, and LIS) and GPM-CO (DPR, GMI) sensors.
The website of Chuntao Liu provides access to the data and additional useful resources to gain insight into the climatology of precipitation features.
UW Storm Classification#
The UW storm classification system Houze et al., 2015 is based on the three-dimensional storm structure measured by the TRMM and GPM radars. It categorizes storms into five types:
Isolated Shallow Echoes (ISE)
Deep Convective Cores (DCC)
Wide Convective Cores (WCC)
Deep-Wide Convective Cores (DWC)
Broad Stratiform Rain areas (BSR).
Tropical Cyclones Database#
The JAXA-EORC Tropical Cyclones Real Time Monitoring and Database websites provide quicklooks of the latest and past tropical cyclones satellite acquisitions of DPR, GMI and AMSR2 sensors.
TC PRIMED#
If you are interested in tropical cyclones studies using PMW data, please also have a look at the TC PRIMED dataset. TC PRIMED contains over 197’000 PMW overpasses of 2’300 global tropical cyclones from 1998 to 2021. This tutorial illustrates how to use GPM-API to analyze the TC PRIMED dataset.

A sampling of TC PRIMED products from Typhoon Maria (2018) at 10:13 UTC on 9 July 2018 in the western Pacific. a) is GPROF, b) is GPM DPR precipitation rate, c) GPM DPR reflectivity, d) 36.6 GHz, e) 89 GHZ, and f) IR from Himawari-8.#
TC PF#
The Tropical Cyclone related Precipitation Feature (TC PF) database is a subset of the TAMU-CC Precipitation Features database. Please refer to Jiang et al., 2011 for more information on the TC PF database. Data are available at this link.
Online Data Explorer#
The JAXA GPM Real-Time Monitor website allows you to visualize near-surface precipitation measurements by TRMM and GPM sensors, from near-real-time back to 1998.
The tool is straightforward to use, whether you are checking if TRMM/GPM sensed a particular precipitation system or simply want to explore precipitation patterns around the world.
If you spot a precipitating system that interests you, activating the Observation Time toggle on the
lower left will enable you to obtain the sensor’s acquisition time with minute-level accuracy.
By copying such acquisition time, you can easily download, analyze and visualize the corresponding data using the GPM API.
The GIF and code snippet here below showcases the step-by-step process for identifying an interesting precipitation event, copying its acquisition time, and leveraging the GPM API for data visualization and analysis.

import gpm
import datetime

product = "2A-DPR"
product_type = "RS"  # "NRT" if less than ~48 h from real-time data
version = 7

start_time = datetime.datetime.strptime("2020/09/17 22:30:00", "%Y/%m/%d %H:%M:%S")
end_time = datetime.datetime.strptime("2020/09/17 22:32:00", "%Y/%m/%d %H:%M:%S")

# Download data over specific time periods
gpm.download(
    product=product,
    product_type=product_type,
    version=version,
    start_time=start_time,
    end_time=end_time,
)

# Open the dataset
ds = gpm.open_dataset(
    product=product,
    product_type=product_type,
    version=version,
    start_time=start_time,
    end_time=end_time,
)

# Plot a specific variable of the dataset
p = ds["precipRateNearSurface"].gpm.plot_map()
If you’re interested in measurements from other satellites, the JAXA Global Rainfall Watch
allows you to visualize the GPM PMW constellation swath coverage over a 1-hour period.
This is achieved by activating the Time and Satellite toggle located in the top right corner of the interface.
Global Precipitation Products#
The state-of-the-art global precipitation satellite-based products available with a temporal resolution of 30 minutes and 0.1° and 0.1° spatial resolutions are GSMAP and IMERG. These products are based on the merging of multiple satellite sensors, including PMW and VIS/IR sensors.
Based on the type of applications your are interested in, you may also want to consider other products, such as PERSIANN, MSWEP, and ERA5. THe following table summarizes some high-quality global precipitation products.
Acronym |
Full Name |
Temporal Resolution |
Spatial Resolution |
Data Source |
|---|---|---|---|---|
IMERG |
Integrated Multi-satellitE Retrievals for GPM |
30 minutes |
0.1° |
|
GSMaP |
Global Satellite Mapping of Precipitation |
30 minutes |
0.1° |
|
CMORPH2 |
Climate Prediction Center MORPHing Precipitation Analysis |
30 minutes |
0.05° |
|
PERSIANN |
Precipitation Estimation from Remotely Sensed Information using Artificial NNs |
1 hour |
0.04° |
|
MSWEP |
Multi-Source Weighted-Ensemble Precipitation |
3 hour |
0.1° |
|
ERA5 |
ERA5 Reanalysis |
1 hour |
0.1° |
GPM-API currently provides only access to the version 6 and 7 of the IMERG products, and the variable IRprecipitation in such IMERG products results from the PERSIANN-CCS and PDIR-Now algorithms respectively.
We welcome contributions that enable GPM-API to access other precipitation products !
Please also note that on Google Earth Engine are available the version 6 of GSMaP and IMERG.
GSMaP can be visualized on the JAXA Global Rainfall Watch, while IMERG on the RAIN-Global Viewer (Regional Animations of IMERG in Near-realtime - Global Edition) , the GPM IMERG Global Viewer and the EOSDIS WorldView Portal.
The GES DISC Interactive Online Visualization ANd aNalysis Infrastructure (Giovanni) also provides quick access to analysis of IMERG products.
Useful Resources#
For those seeking detailed information and resources related to the GPM Mission and associated satellite measurements, the following table organizes key links to FAQs, training materials, specific mission pages and ATBDs.
This compilation provides a comprehensive starting point for researchers, students, and enthusiasts to explore educational resources and technical details.
Resource Type |
Description |
URLs |
|---|---|---|
Training |
Additional information and training resources |
|
GPM News |
News related to the GPM mission |
|
GPM FAQ |
Frequently Asked Questions about GPM data |
|
GPM Mission |
Global Precipitation Measurement Mission |
|
TRMM Mission |
Tropical Rainfall Measuring Mission |
|
GPM Products Handbook |
Data Handbook and File Specifications |
|
ATBDs |
Algorithm Theoretical Basis Documents |
GPM PMW sensors |
Full Name |
URLs |
|---|---|---|
AMSR-E |
Advanced Microwave Scanning Radiometer-EOS |
|
AMSR2 |
Advanced Microwave Scanning Radiometer 2 |
|
AMSU-B |
Advanced Microwave Sounding Unit-B |
|
ATMS |
Advanced Technology Microwave Sounder |
|
MHS |
Microwave Humidity Sounder |
|
SAPHIR |
Sondeur Atmospherique du Profil d’Humidite Intertropicale par Radiometrie |
|
SSMIS |
Special Sensor Microwave - Imager/Sounder |
Other PMW sensors |
Full Name |
URLs |
|---|---|---|
GEMS |
Global Environmental Monitoring System |
|
MTVZA |
Microwave Imaging/Sounding Radiometer |
|
MWHS |
Microwave Humidity Sounder |
|
MWRI |
Microwave Radiometer Imager |
|
TEMPEST-D |
Temporal Experiment for Storms and Tropical Systems Demonstration |
|
Tomorrow Sounder |
Tomorrow.io Sounder |
|
TROPICS |
Time-Resolved Observations of Precipitation structure and storm Intensity with a Constellation of Smallsats |
|
WindSat |
WindSat Polarimetric Microwave Radiometer |
Other radar sensors |
Full Name |
URLs |
|---|---|---|
PMR |
Feng Yun Precipitation Measurement Radar |
|
RainCube |
Radar in a CubeSat |
|
Tomorrow R1 and R2 |
Tomorrow.io’s Radar |